Click here to download a PDF version of this document.
In December 2016, the United States Environmental Protection Agency (EPA) published the final version of the “Hydraulic Fracturing for Oil and Gas: Impacts from the Hydraulic Fracturing Water Cycle on Drinking Water Resources in the United States” (the “Study”). This Study is the result of work that began with a scoping document drafted in 2010 and included peer reviews, technical roundtables, and public comments that involved more than 100,000 people. The EPA maintains a repository of information regarding the Study online at www.epa.gov/hfstudy. This repository includes the Final Report from the Study, which can be downloaded by clicking here and then selecting the gray “Downloads” tab and choosing from the following documents:
- The Executive Summary (50 pages, 8 MB download)
- The Main Report (666 pages, 48 MB download)
- The Appendices (572 pages, 10 MB download).
RKR Hess has been following the progress of the report (here and here) and is pleased to provide a high-level review of the findings, highlights of data and conclusions specifically relevant to Marcellus Shale hydraulic fracturing in Pennsylvania, and links to additional information. We have maintained figure and text box references to the images pulled from the above reports so that they can be easily found in the context of the original report.
Study Scope
Based on direction from the U.S. Congress and as developed in the scoping document, the intention of the Hydraulic Fracturing Study was to evaluate the potential impacts of hydraulic fracturing for oil and gas on drinking water resources. The intended uses of the Study results include:
- Understanding the potential impacts of activities in the hydraulic fracturing water cycle on drinking water resources and the factors that influence those impacts
- Facilitating and informing dialogue among stakeholders
- Supporting future site-specific exposure or risk assessments of hydraulic fracturing activities by providing a national context for operations and potential impacts
- Presenting scientific evaluations to inform regulatory decision-making to best protect drinking water resources.
The scope specifically does not address potential issues beyond impacts to drinking water such as air quality impacts or induced earthquakes. It also does not address activities associated with oil and gas exploration or production activities outside of the hydraulic fracturing water cycle, such as: site selection, other infrastructure development (e.g., roads, pipelines, compressor stations), or well closure. Lastly, the study is specifically not intended to be a human health risk assessment (HHRA). An HHRA generally includes four basic steps:
- Hazard identification
- Dose-response assessment
- Exposure assessment
- Risk characterization.
While the Study provides some data in support of the first two parts of an HHRA, the other parts could not be performed because many necessary data points are specific to site, timing, and affected populations. These specific characteristics present too many unknowns for a general or nationwide assessment to be performed. The Study defines the term “drinking water resources” more broadly than is common in regulation and research. As used here, it considers any water that currently serves or in the future could serve as a source of drinking water for public or private use. This definition includes both surface water and groundwater.
Hydraulic Fracturing Background
According to the Study, between 2000 and 2014 approximately 300,000 wells were hydraulically fractured and approximately 20,000 new wells were drilled and hydraulically fractured in 2015. Between 2000 and 2013, approximately 3,900 public water serving systems supplying approximately 8.6 million people year-round were estimated to have had at least one hydraulically fractured well within one mile of their water source (not necessarily within one mile of the treatment or distribution facilities).
Hydraulic fracturing is the process of injecting hydraulic fracturing fluids through a production well into oil- and gas-bearing geologic formations at pressures high enough to fracture the rock. The fractures created in the rocks allow oil and gas to be recovered through the production well. Hydraulic fracturing fluids frequently contain water, proppants (materials that help hold open the fractures), and additives that modify the properties of the fluid. (Please see the Chemical Mixing section for more information on the constituents of hydraulic fracturing fluid.)
Figure 3-5 from the Study provides an overall summary of the activities that take place during a typical oil or gas well life cycle. Note that the actual hydraulic fracturing can take between a day and a few weeks, while production of oil or gas from the well can last for decades.
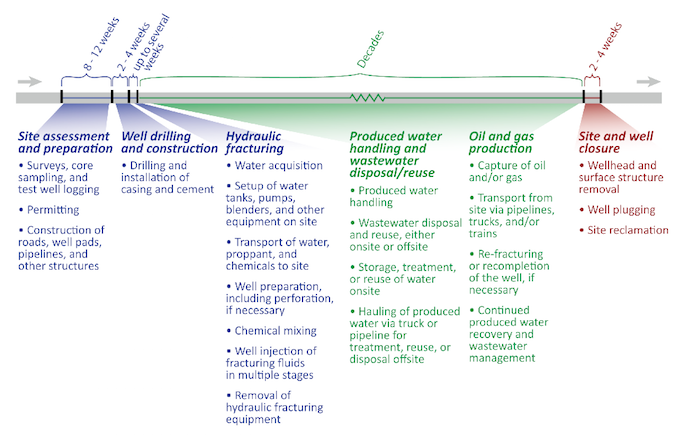
Figure ES 3-5. General timeline and summary of activities.
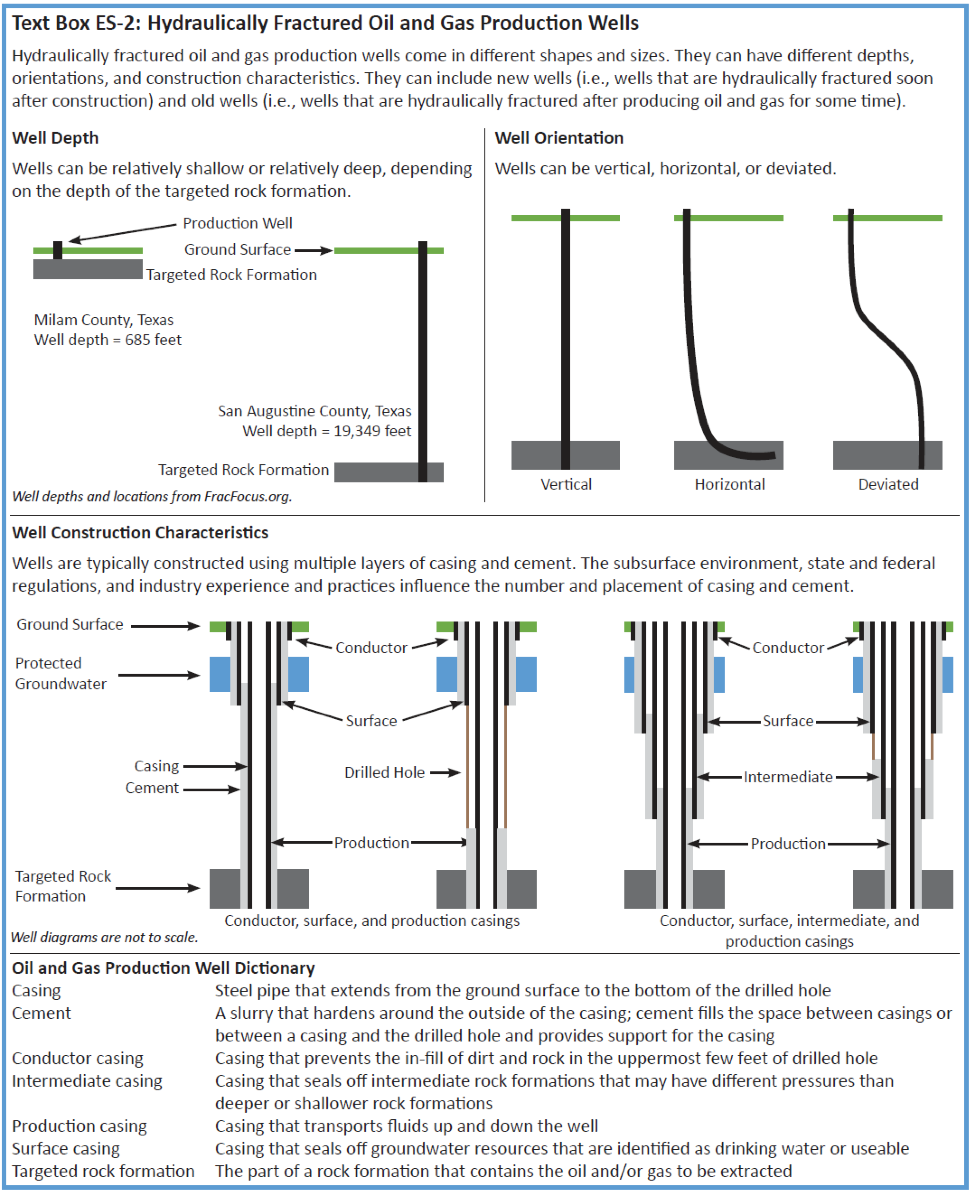
Text Box ES-2 from the Study’s Executive Summary provides a good overview of how a production well is constructed.
The Study defines the hydraulic fracturing water cycle to include:
- Water acquisition
- Mixing of hydraulic fracturing fluids
- Injecting hydraulic fracturing fluids in oil and gas production wells
- Produced water handling (i.e., onsite collection and handling of fluids that return to the surface)
- Disposal/reuse of produced water.
Note that the Study only evaluated the water-cycle impacts during hydraulic fracturing operations, produced water handling, and wastewater disposal/reuse operations (i.e., the last item in blue and the two items in green on Figure 3-5). There are water cycle impacts during the other portions of the well lifecycle, however these impacts were not evaluated.
Water Acquisition
The Study documents the EPA’s review of the potential impacts of water withdrawals for hydraulic fracturing on drinking water resource quantity and quality. The primary data source was reports made to FracFocus. FracFocus is a website, managed by the Ground Water Protection Council (GWPC) and Interstate Oil and Gas Compact Commission (IOGCC), to provide a national registry for chemicals used in hydraulic fracturing. It was originally based on the voluntary submission of data from well operators; however, some states (including Pennsylvania) now require disclosure to FracFocus. Between 1 January 2011 and 28 February 2013 there were approximately 38,000 disclosures to FracFocus. These disclosures formed the basis for the data set evaluated by the EPA. It should be noted that the EPA used data from FracFocus 1.0. The website is in the process of upgrading to FracFocus 3.0.
In Pennsylvania, the FracFocus database showed 2,445 disclosures. Pennsylvania had the third largest number of disclosures after Texas (16,882 disclosures) and Colorado (4,898 disclosures). The median volume of water used per well in Pennsylvania was 4.2 million gallons, and the smallest volumes (those in the 10th percentile) were 2.3 million gallons per well. Both Texas and Colorado used less water per well on average than Pennsylvania. Texas operations reportedly used a median volume of 1.4 million gallons per well; Colorado operations used a median volume of 463,462 gallons. Specific reasons for these variations were not identified in the Study; however, deeper wells and wells in “tight” geologic formations (including shales) tended to require more water than shallower wells and those in looser formations (such as coalbeds).
In most counties, the nationwide average annual water volumes reported in the FracFocus data were less than 1% of total water use. However, in the Pennsylvania counties examined by the Study, water used for hydraulic fracturing represented a significant percentage of water use. The data in the table below is drawn from Table 4-3 of the Study. Note that due to different sources and the availability of data, the years of use do not align.
| County | Total Annual Water Use 2010 (millions of gallons) | Average Annual Hydraulic Fracturing Water Use 2011/2012 (millions of gallons) | Hydraulic Fracturing Water Use as a Percentage of Total Water Use |
| Susquehanna | 1,617.0 | 751.3 | 46.5 |
| Sullivan | 222.7 | 66.5 | 29.9 |
| Bradford | 4,354.5 | 1,059.4 | 24.3 |
| Tioga | 2,090.1 | 566.3 | 19.5 |
| Lycoming | 5,854.6 | 704.6 | 12.0 |
The Study uses the Susquehanna River Basin as an example to highlight regional differences in water budgets shown on Figure ES-4. As the figure shows, in the Susquehanna River Basin an average of between 4.1 and 4.6 million gallons of water are injected into the well during hydraulic fracturing operations. Approximately 79% of this volume comes from surface waters, approximately 7% from groundwater, and approximately 14% from produced water from other gas wells. Volumes of reused water are included in both columns of the preceding table. 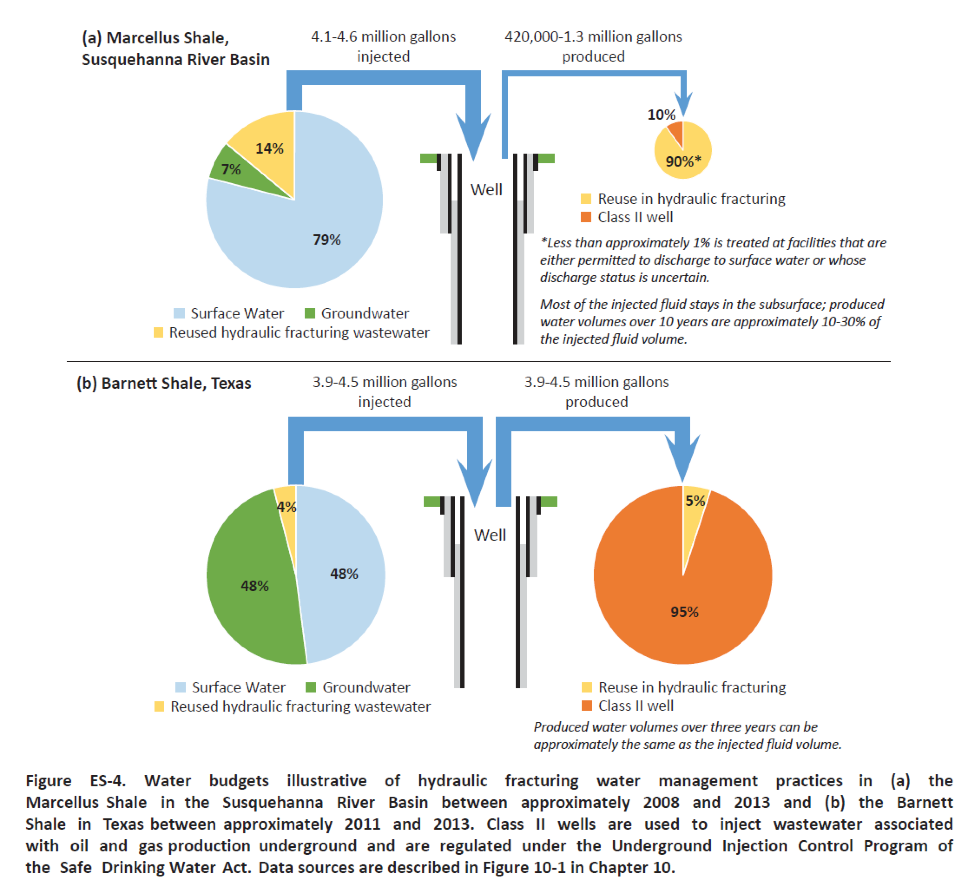 Based on the results of the Study, the volumes of water required for hydraulic fracturing can be considerable, so proper management of source water is essential. The Study includes recommendations for specific regulatory approaches that include: encouraging use of alternative water sources (e.g., reuse of oil and gas wastewater as hydraulic fracturing fluid), timing of water withdrawals to avoid low water availability for other uses, and restricting withdrawals in areas with limited or declining groundwater resources.
Chemical Mixing Generally, hydraulic fracturing fluid is produced onsite by mixing water with proppants and additives. Proppants (most often sand) are generally the second largest components of hydraulic fracturing fluid. They serve to hold open the fractures induced by the process to promote movement of oil and gas to the production well. Additives are used to adjust the characteristics of the hydraulic fracturing fluid. Frequently, additives are used to adjust the pH of the fluid, change the fluid viscosity, or limit bacterial growth in the well. Although additives are the smallest proportion of hydraulic fracturing fluid constituents, they have the greatest potential to impact the quality of drinking water resources. Proppants and additives are typically delivered to the well site in closed containers that range in volume between 200 and 375 gallons each. Generally, hydraulic fracturing fluid is mixed on an as-needed basis. The water, proppant and additives are drawn from the storage tanks, blended, and then pumped down the well at high pressure. Text Box ES-7 from the Study provides an image of a typical layout for mixing equipment at a well head. 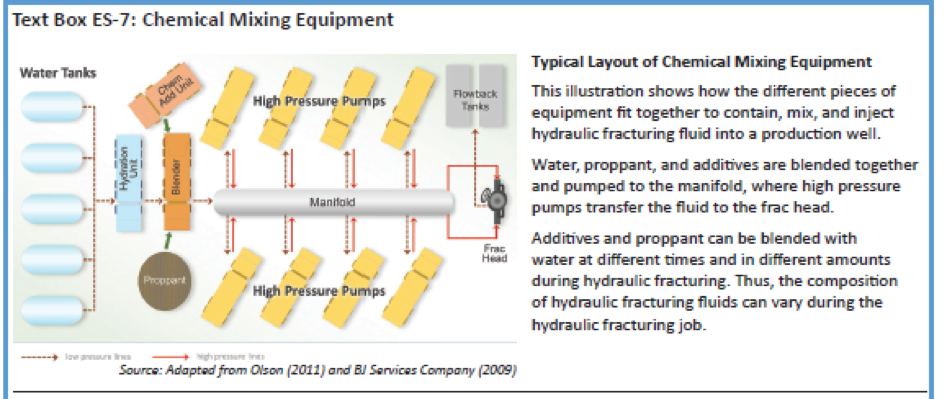 As a part of the research for the Study, the EPA reviewed data from FracFocus 1.0 to identify the chemicals used to create hydraulic fracturing fluids. Based on this data set, the EPA identified approximately 1,100 chemicals used in hydraulic fracturing fluids between 2005 and 2013 (see Table H-2 in the Appendices for the complete list) and approximately 600 chemicals in produced water (see Table H-4 in the Appendices for the complete list). There is some overlap between the chemicals in the produced water list with the chemicals used list, but the two lists cannot be directly compared because standard chemical names and confirmed identities (as measured by a valid Chemical Abstract Services Registry Number [CASRN]) could not be confirmed for the entirety of each list.
The EPA estimated the frequency of use for approximately 688 chemicals based on the FracFocus 1.0 data. On average, there were between 4 and 28 chemicals used in each well; however, no single chemical was used in all wells. It should also be noted that well operators claimed at least one chemical as confidential at more than 70% of the wells reported to FracFocus. The Study identifies chemicals reported in more than 10% of disclosures to FracFocus 1.0 between January 1, 2011 and February 28, 2013, in Table ES-2, Table 9-2, and Appendix C. Care must be taken when comparing these lists as there are some distinctions in how the data was treated. For example, water, quartz, and sodium chloride were excluded from consideration in Table 9-2 but included in Table ES-2. In addition, Tables C-1 and C-2 distinguish between chemicals used at gas-producing wells and chemicals used at oil-producing wells. This distinction is not made in the other data.
The table below presents the additive ingredients most frequently reported to FracFocus 1.0 from wells in Pennsylvania. There were 2,483 disclosures for Pennsylvania wells in the data set, and all but one of the wells were for production of natural gas. The Chemical Abstracts Service (CAS) number can be used to identify and search for data on a chemical without being concerned about synonyms (e.g., “methanol” can also be called “methyl alcohol” or “wood spirits,” but will always have CAS no. 67-56-1). The EPA reported two “median of maximum concentrations by mass” values—one for the concentration of the chemical in the hydraulic fracturing fluid and a second for the concentration of the chemical in the additive prior to mixing. In the table below, we report the median maximum concentration of the chemical in the hydraulic fracturing fluid as this value represents a measure of the quantity of the chemical introduced to the environment. The EPA excluded data from 101 disclosures due to invalid CAS numbers. In addition, the EPA excluded chemicals identified as confidential business information (CBI) by well operators. At least one CBI chemical was identified in approximately 47% of the disclosures from Pennsylvania. We have also excluded water from the table below.
Where possible, we have included links to the National Institute for Occupational Safety and Health (NIOSH) International Chemical Safety Cards (ICSC) and to the EPA’s Integrated Risk Information System (IRIS) for each chemical. Chemicals without data in the selected database are marked “Not Available” (N/A). The NIOSH ICSCs provide information about the hazards posed by each chemical and the workplace safety measures appropriate for each hazard type. The IRIS database provides data on the carcinogenic and toxicity effects of chronic exposure to chemicals based on peer-reviewed studies. It should be noted that the dose received, the length of exposure, the frequency of exposure, and other parameters will affect how a given chemical exposure will affect a person’s health. The IRIS database distinguishes between noncancer health effects and increased cancer risk. The data in IRIS can be used to support the first two steps in a Human Health Risk Assessment (HHRA). However, in order to determine the potential effects of the use of a chemical in hydraulic fracturing fluid, additional site-specific information would need to be evaluated.
| EPA standardized chemical name | CASRegistry Number | % Disclosures | Median of max concentration by mass in HF fluid % | NIOSH ICSC | EPA IRIS |
| Hydrochloric acid | 7647-01-0 | 91.78 | 0.06500 | 0163 | 396 |
| Methanol | 67-56-1 | 65.77 | 0.00061 | 0057 | 305 |
| Distillates, petroleum, hydrotreated light | 64742-47-8 | 57.75 | 0.02100 | 1379 | N/A |
| Propargyl alcohol | 107-19-7 | 55.22 | 0.00005 | 0673 | 468 |
| Glutaraldehyde | 111-30-8 | 32.98 | 0.00400 | 0158 | N/A |
| Ethylene glycol | 107-21-1 | 32.50 | 0.00470 | 0270 | 238 |
| 2,2-Dibromo-3-nitrilopropionamide | 10222-01-2 | 32.38 | 0.00500 | N/A | N/A |
| Isopropanol | 67-63-0 | 29.60 | 0.00029 | 0554 | N/A |
| Ammonium chloride | 12125-02-9 | 29.48 | 0.00220 | 1051 | N/A |
| Citric acid | 77-92-9 | 28.23 | 0.00120 | 0855 | N/A |
| Polyethylene glycol | 25322-68-3 | 27.71 | 0.01400 | 1517 | N/A |
| Guar gum | 9000-30-0 | 21.67 | 0.00190 | N/A | N/A |
| 2-Butoxyethanol | 111-76-2 | 20.06 | 0.00011 | 0059 | 500 |
| Sodium hydroxide | 1310-73-2 | 16.35 | 0.00120 | 0360 | N/A |
| Ethanol | 64-17-5 | 15.63 | 0.00130 | 0044 | N/A |
| Quaternary ammonium compounds, benzyl-C12-16-alkyldimethyl, chlorides | 68424-85-1 | 15.02 | 0.00230 | N/A | N/A |
| Sodium persulfate | 7775-27-1 | 15.02 | 0.00009 | 1136 | N/A |
| Hemicellulase enzyme | 9012-54-8 | 14.78 | 0.00001 | N/A | N/A |
| Tri-n-butyl tetradecyl phosphonium chloride | 81741-28-8 | 14.10 | 0.00210 | N/A | N/A |
| 2-Amino-2-methylpropan-1-ol | 124-68-5 | 12.04 | 0.00018 | 0285 | N/A |
| 3,4,4-Trimethyloxazolidine | 75673-43-7 | 12.04 | 0.00090 | N/A | N/A |
| 4,4-Dimethyloxazolidine | 51200-87-4 | 12.04 | 0.01400 | N/A | N/A |
| Didecyl dimethyl ammonium chloride | 7173-51-5 | 11.92 | 0.00230 | N/A | N/A |
| Thiourea polymer | 68527-49-1 | 11.28 | 0.00017 | N/A | N/A |
| Sodium chloride | 7647-14-5 | 11.08 | 0.00500 | N/A | N/A |
Nationally, different chemicals were used at greater frequency than those in the table above. The large number of chemicals potentially used in hydraulic fracturing processes include some chemicals with known adverse human health effects. However, because of the variability in chemical use, the potential for interactions with local geology, and site-specific factors related to the probability of discharge to the environment, the EPA recommends that health hazard assessments be conducted at local and/or regional scales using the multi-criteria decision analysis approach described in Chapter 9 of the Study. The Study does include a preliminary assessment of potential human health effects of chemicals used in hydraulic fracturing fluids nationally. The toxicology data was required to meet five criteria for inclusion in the report.
- Data must be from a government or inter-government body.
- Data source must be peer-reviewed.
- Data must be based on peer-reviewed data.
- Data must be focused on protection of the general public.
- Source must be free of conflicts of interest with respect to chemicals for which it derives values or assessments.
The EPA evaluated the 1,606 chemicals identified in the FracFocus 1.0 data set (see Tables G-1e and G-2e) and determined that sufficient data was available to assess 207 chemicals:
- 21 chemicals were listed as known carcinogens in humans in data sources reviewed
- 66 were listed as probable or possible carcinogens in humans in data sources reviewed
- 117 were not classifiable regarding human carcinogenicity
- 3 were listed as not likely to be human carcinogens.
During chemical mixing, the primary risk to drinking water is posed by spills and leaks. The EPA studied incidents reported to state or industry sources in 11 states that occurred between January 2006 and April 2012. The study found 151 incidents that were tied to chemical mixing and determined that most incidents are caused by equipment failure (34%), with human error an additional significant source of spills (25% of incidents). It should be noted that in 26% of the incidents examined the root cause of the spill was unknown. For the 151 incidents, the volume of fluid spilled in each incident ranged from 5 gallons to 19,320 gallons, with a median volume of 420 gallons spilled. In 13 of the 151 incidents spilled fluid reached surface waters. The EPA study also identified 457 incidents that were related to hydraulic fracturing operations generally (these incidents include the 151 chemical mixing-related incidents). For this larger group of incidents, human error was the cause of 33% of the incidents and equipment failure was the cause of 27%. A root cause was not identified for 25% of these incidents. The Final Assessment concludes that the impact of accidental releases on groundwater or surface water resources depends on:
- Site-specific spill prevention and control systems (e.g., secondary containment and spill response procedures and equipment)
- Site-specific geology and topography
- Physical properties and volume of the chemical spilled
- Characteristics of the receiving water resource.
Well Injection During well injection, hydraulic fracturing fluids primarily move along two routes: the production wells themselves and the underground fracture networks. However, it is also possible for hydraulic fracturing fluid to move vertically through nearby wells that are either operational or abandoned.
Production wells are designed to move fluids to and from the target rock formation without leaking. This is generally accomplished by installing multiple layers of casing and cement within the boring (see Text Box ES-2). During hydraulic fracturing there are greater pressure and temperature changes within a well and the connecting rock formations than at any other time in a well’s life. These pressure and temperature changes are what cause the fracture network in the rock formation to grow. It is possible for the fracture network to extend into overlying groundwater reservoirs; however, the specific risk depends on the characteristics of the rock formation and the operational approach taken. Fracture growth can be controlled by limiting the rate and volume of hydraulic fracturing fluid injected into the well. In addition, the risk of adverse impact is lower if there is a larger vertical distance between the intended fracture network and the groundwater. There is some evidence to suggest that fractures in shale formations can extend vertically for significant distances, in some cases to more than 1,000 feet. However, detailed fracture mapping is not commonly performed, so it is difficult to assess the overall prevalence of impacts to drinking water resources through this route.
The pressure and temperature changes during well injection can cause issues with the mechanical integrity of the wells, particularly for older wells. Some studies of well failures and regulatory actions indicate that between 0.06% and 0.5% of wells experience a failure of mechanical integrity. The data set used by Considine (discussed in the Pennsylvania Environmental Impacts section of this summary) suggests a slightly higher rate of 2.5% based on the number of blowout and venting incidents, and the number of cement and casing incidents.
A third potential pathway for vertical movement of hydraulic fracturing fluid is through nearby wells. There have been cases where hydraulic fracturing at one well affected another well more than 8,000 feet away. Generally, however, the Study found that impacts on nearby wells are more likely if the horizontal distance between wells at the surface is within 1,100 feet.
Produced Water Handling
Immediately after fracturing, most of the fluid that returns to the surface is hydraulic fracturing fluid (frequently called “flowback”). Over time, however, more of the fluid that comes to the surface is natural groundwater and contains oil or gas. The Study defines “produced water” as both initial flowback and subsequent fluid that comes to the surface. Marcellus Shale wells typically produce 10-30% of the water injected in the first 10 years after hydraulic fracturing (e.g., for 4.1 million gallons injected into a well, between 420,000 and 1.3 million gallons of fluid will likely be produced by that well over the next 10 years). The volume of produced water per day generally declines over time.
After reaching the surface, the oil and gas are separated and collected from the water, which must be collected and disposed of. The specific characteristics of produced water generally depend on the target rock formation, but it may contain:
- Salts
- Metals (e.g., barium, manganese, iron, strontium)
- Naturally occurring organic compounds
- Naturally occurring radioactive material (radium, uranium, thorium)
- Hydraulic fracturing chemicals.
Produced water flows from the well to onsite tanks or pits through pipes. The produced water is then transported offsite for disposal or reuse, usually by truck or pipeline.
Spills of produced water can occur during collection, storage, or transportation for disposal or reuse. The median spill volumes documented by the Final Assessment range between 340 gallons and 1,000 gallons; however, in North Dakota there were 12 spills greater than 21,000 gallons in 2015. As with spills during chemical mixing, the environmental impacts of spills of produced water will depend on incident-specific circumstances. The severity of impacts can be reduced through the implementation of spill prevention and response activities.
Wastewater Disposal and Reuse
According to the Study, produced water is generally either injected into a Class II well, reused in other hydraulic fracturing operations, or otherwise disposed of above ground (e.g., at a publicly owned treatment works).
A Class II well is a well intended for the injection of fluids related to oil and gas production. These wells are regulated under the Safe Drinking Water Act (SDWA) or state regulations. SDWA Section 1422 sets requirements for the construction, operation, monitoring and testing, reporting, and closure of wells. SDWA Section 1425 imposes minimum requirements for state regulations covering permitting, inspections, monitoring, recordkeeping, and reporting for Class II wells. Class II well disposal is the most frequent disposal method for produced water nationwide, especially in Texas, Kansas, Oklahoma, Louisiana, and Illinois. Although there are approximately 180,000 Class II wells in operation in the United States, very few of them are in Pennsylvania. It is believed that this drove an increase in the volume of wastewater reused in Pennsylvania between 2008 and 2014, e.g., in the Susquehanna River Basin, where an estimated 90% of produced water was reused in other hydraulic fracturing operations.
Aboveground disposal generally results in wastewaters being discharged to land or surface waters, usually after treatment. In Pennsylvania, wastewater treatment facilities were unable to adequately remove high total dissolved solids (TDS) from Marcellus Shale wells, and discharges were identified as the source of issues in the Monongahela River Basin. In response, the Pennsylvania Department of Environmental Protection (PADEP) revised regulations to limit impacts on groundwater and surface water resources from aboveground disposal of hydraulic fracturing wastewater.
Pennsylvania Environmental Impacts
In the Study, the EPA cites research published in 2012 titled “Environmental Impacts During Marcellus Shale Gas Drilling: Causes, Impacts, and Remedies” by Considine, et. al. Although not addressed in detail in the EPA Study, given the focus on Pennsylvania the research is discussed here. The research conducted a detailed analysis of notices of violation (NOVs) PADEP issued to operators of natural gas wells in Pennsylvania between January 2008 and August 2011. The researchers classified each NOV as an administrative violation (i.e., a violation of regulation that did not include an environmental impact) or as an environmental violation (i.e., a violation of regulation that involved an environmental impact). Note that a single event may have resulted in multiple violations. Environmental violations were further subdivided into major and minor events, and then into categories based on the type of events, including:
- Blowouts and venting
- Spills on land (a major spill was considered a release of more than 400 gallons)
- Gas migration
- Cement and casing
- Site restoration
- Surface water contamination.
Of the 2,988 violations issued, approximately 60% involved administrative violations only. The remaining NOVs were issued as a result of 845 events that adversely impacted the environment. The researchers categorized the events for major or minor impacts and tallied the totals.
| 2008 | 2009 | 2010 | Jan – Aug 2011 | Total | |
| # Wells Drilled | 170 | 710 | 1,405 | 1,248 | 3,533 |
| Major Impacts | |||||
| Blowouts & Venting | 0 | 0 | 2 | 2 | 4 |
| Major Land Spills | 0 | 2 | 2 | 5 | 9 |
| Gas Migration | 0 | 1 | 1 | 0 | 2 |
| Site Restoration | 1 | 0 | 0 | 1 | 2 |
| Water Contamination | 0 | 5 | 1 | 2 | 8 |
| Major Impact Subtotal | 1 | 8 | 6 | 10 | 25 |
| % Wells with Impact | 0.59% | 1.13% | 0.43% | 0.80% | 0.71% |
| Minor Impacts | |||||
| Cement & Casing | 0 | 2 | 27 | 56 | 85 |
| Minor Land Spills | 4 | 56 | 66 | 23 | 149 |
| Site Restoration | 72 | 68 | 90 | 98 | 328 |
| Water Contamination | 13 | 39 | 133 | 73 | 258 |
| Minor Impact Subtotal | 89 | 165 | 316 | 250 | 820 |
| % Wells with Impact | 52.35% | 23.24% | 22.49% | 20.03% | 23.21% |
| Total # of Events | 90 | 173 | 322 | 260 | 845 |
| % Wells with Impacts | 52.94% | 24.37% | 22.92% | 20.83% | 23.92% |
The researchers documented 25 events during the period examined that were considered to have had major impacts, representing less than 1% of wells drilled during the period. Minor impacts were significantly more common, reaching more than half of all wells drilled in 2008. However, the number of wells experiencing a minor impact declined during the period examined.
Based on this data, the researchers concluded that the number of environmental events that caused physical impact on the environment declined in conjunction with action by state regulators. The fact that regulatory changes drove a reduction in the number of environmental impacts suggested to the researchers that the way in which activities at the surface are conducted is the greatest ongoing risk, rather than the drilling or well development process itself. The researchers concluded that the PADEP has been able to effectively manage the risks associated with unconventional gas development.
Conclusions In addition to the conclusions associated with each phase of the hydraulic fracturing water cycle, the Study provided several general conclusions and recommendations. Specifically, the Study concluded that more frequent or more severe impacts from hydraulic fracturing are expected if:
- Water withdrawals occur in areas of low water availability
- Spills during management of hydraulic fracturing fluids or of produced water that result in large volumes or high concentrations of chemicals reach groundwater resources
- Injection of hydraulic fracturing fluids into wells with inadequate mechanical integrity occurs
- Injection of hydraulic fracturing fluids into groundwater resources occurs
- Discharge of inadequately treated wastewater to surface water resources occurs
- Disposal or storage of wastewater in unlined pits occurs.
The Study also noted significant data gaps that prevented calculation or estimation of the national impacts on drinking water resources. Data gaps included:
- Locations of hydraulic fracturing activities, including: withdrawals, well locations, mixing locations, handling locations and disposal locations
- Depths of groundwater resources in areas where hydraulic fracturing is performed
- Belowground fracture growth patterns and mapping before and after hydraulic fracturing
- Local water quality data pre-, during, and post-hydraulic fracturing
- Complete chemical identities used in hydraulic fracturing
- Toxicity data for chemicals used in hydraulic fracturing (e.g., data was not available for 89% of the chemicals evaluated)
- Consistency of data available across regions.
The Study included the following recommendations:
-
- Additional research specifically to better characterize the environmental fate and transport, and the human health hazards associated with chemicals in the hydraulic fracturing water cycle
- Regulatory focus on local or regional scale activities that are most likely to result in more frequent or more severe impacts to water resources, particularly:
- Timing of water withdrawals to avoid low water availability for other uses
- Restricting withdrawals in areas with limited or declining groundwater resources
- Controlling spills during the mixing and use of hydraulic fracturing fluids, chemicals and produced water
- Ensuring the mechanical integrity of wells
- Preventing injection of hydraulic fracturing fluids directly into groundwater resources
- Proper treatment of hydraulic fracturing wastewater
- Preventing disposal or storage of wastewater in unlined pits.
The Study also notes that hydraulic fracturing practices and operations continue to evolve; therefore, evaluation of the potential adverse impacts will need to continue. Click here to download a PDF version of this document.